Once you have created your Monitoring List, you can access Risk Insights directly from the desired list. You'll find Risk Insights in the upper right corner.
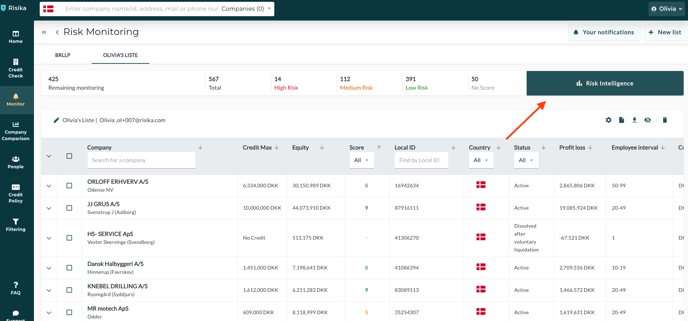
If you haven't set up a monitoring list yet, you can learn how to do it here: https://help.risika.dk/monitoring-setup
Overview of Risk Intelligence
Risika Credit Score
On this page, you can delve into your portfolio of companies to gain a better understanding of how your risk is distributed across various parameters. This could include how the risk distribution is based on industry groups within your portfolio.
Below is a list of all the parameters on which you can assess your risk. In this article, we highlight a few of them.
Parameter List:
- Risika credit score
- Distribution of Risika credit scores
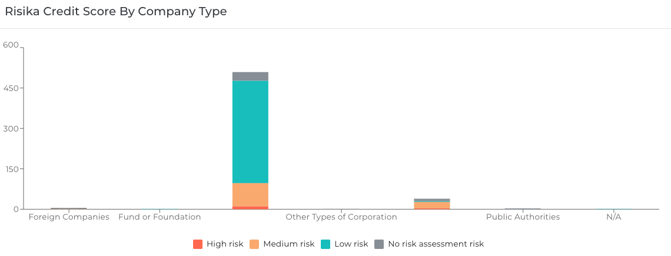
- Risika credit scores by company type
- Risika credit scores by number of employees
- Risika credit scores by geographical location
- Risika credit scores by industry
- Development of Risika credit scores
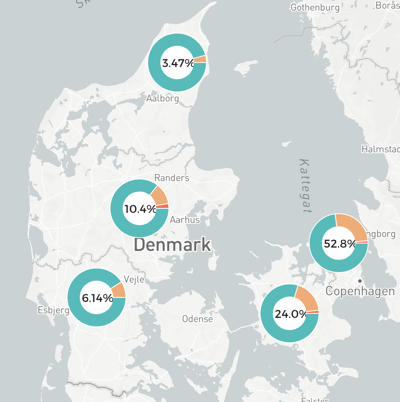
Risika credit scores by geographical location
In this example, you can gain insight into how your portfolio's risk is distributed geographically. Here, we can see that the majority of companies are located in the Sjælland region, but there are several companies in the Midtjylland region with a low Risika score, indicating a high level of risk.
If you have companies on your list from Sweden or Norway, they will also be visible here.
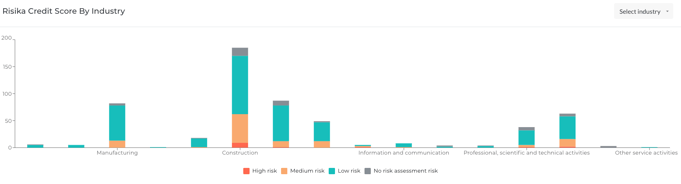
Risika credit scores by industry
Here, you get an overview of all the industry groups within your portfolio and the associated risk for each industry group.
You also have the option to click into a specific industry to see the same overview broken down by individual industries within the overarching industry group.
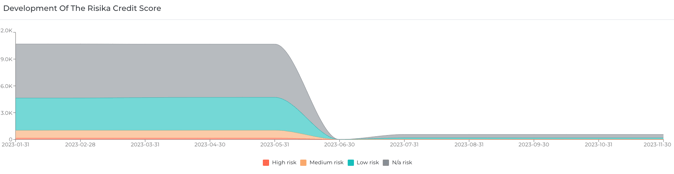
Development of Risika credit scores
In this example, we are looking at a monitoring list that has been active since 2020.
Here, you can see how many companies are on your list and what proportion falls into the three risk groups: high, medium, and low risk. As more companies have been added to the list over time, the highlighted area increases, but at the same time, the red group has become smaller, indicating a decrease in risk in the portfolio over time.
Financial Performance
On this page, you can gain a better overview of your portfolio in terms of key financial metrics, such as average annual result, average equity, and more. Similar to the previous page, there are several categories you can delve into:
- Average annual result
- Average equity
- Average number of employees
- Key metrics by company type
- Key metrics by industry
- Development of key metrics
- Development of compliance with credit policy
Key metrics by company type
Here, you get insight into key metrics broken down by the types of companies on your list. By hovering your mouse over a company type, you can see the average Risika score, liquidity ratio, return on equity, and solvency ratio.
Key metrics by industry
This section displays the same information as the previous information box, but it's categorized by the industries in your portfolio.

Development of compliance with credit policy
In the credit policy development section, you can see how your portfolio changes in terms of compliance with your credit policy.
Screenshot 2023-02-27 at 16.50.00
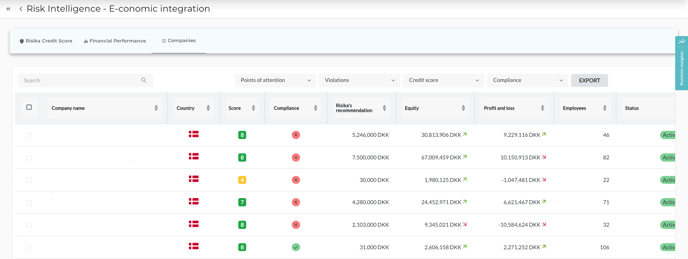
Companies
The "Companies" page simply displays your entire portfolio. Here, you can easily see whether companies comply with your credit policy or not, along with some figures and their trends.
You can also apply various sorting options, such as filtering for companies with high risk or those not meeting specific points in your credit policy.
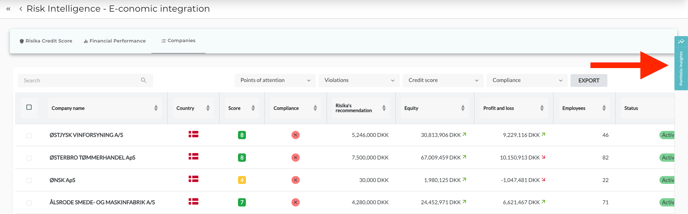
Portfolio Insights
You can access portfolio insights by clicking on the blue tab on the right side.
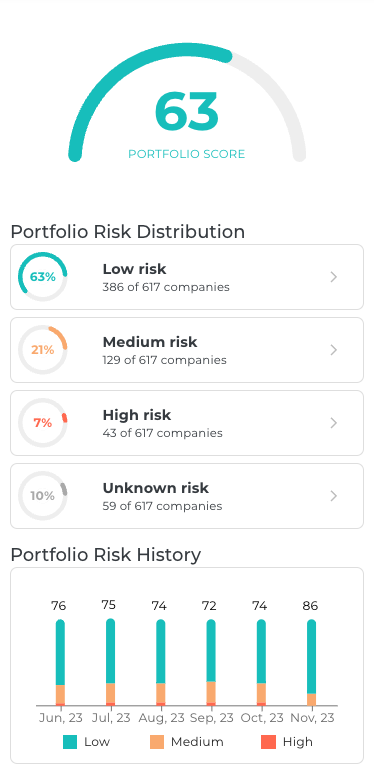
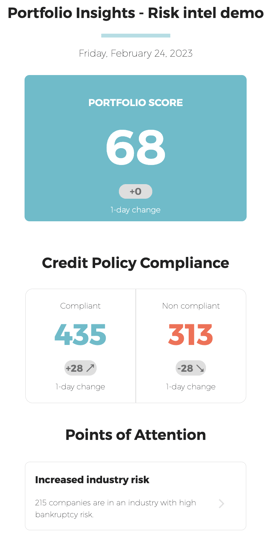
Summary
On the first tab, you'll find the Summary. The first thing you'll see is a Portfolio Score, which is an overall score based on your entire portfolio.
Furthermore, you'll be presented with a Risk Distribution of your portfolio and a history of the Portfolio Score, allowing you to track how it has changed in previous months.
Further down in the summary, you'll find all the attention points that you're familiar with from the Credit Check page for any companies in your portfolio.
It's worth noting that you can click on the different points in the risk distribution and attention points, which will show you the companies that match the selected criteria on the company page.
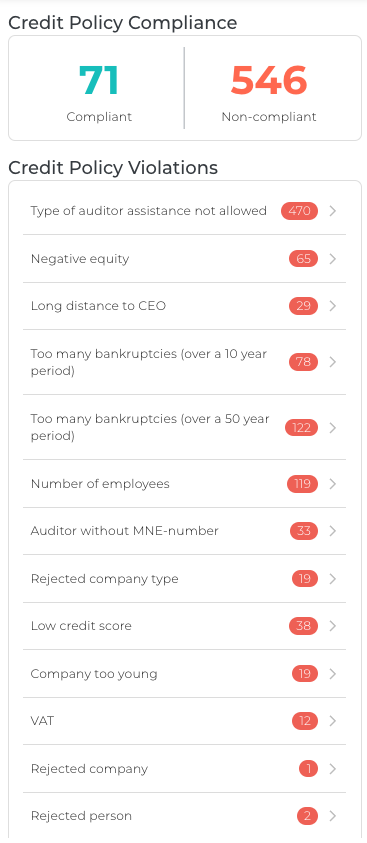
Compliance with Credit Policy
You also have the option to gain insight into exactly which criteria your portfolio is not complying with, such as rejected individuals or companies with too many bankruptcies compared to your allowed threshold.
All the points you see here align with the credit policy you have set up. You can click on each
point to view the companies that do not comply with the credit policy based on the selected criterion.
At the bottom of this window, you'll also find a history, allowing you to see how your portfolio's compliance with your credit policy has evolved over time.
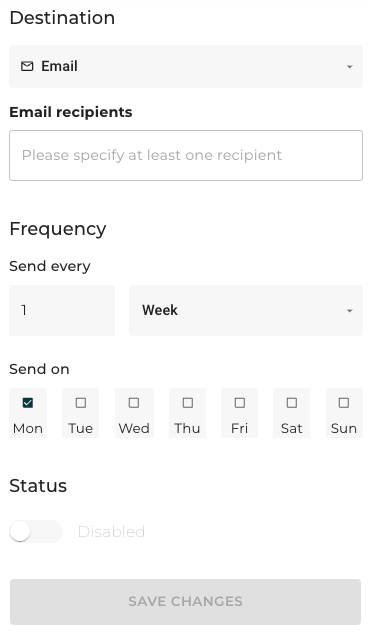
Planner
In the Planner, you have the option to receive an email updating you on how your portfolio changes in relation to your credit policy. Simply enter your email or a colleague's email in the "Email recipients" field.
Then, choose how often this email should be sent.
The email you receive may look like this:
These are all the features of the Risk Intelligence module. If you have any questions about the functionality or would like to try it out, please don't hesitate to reach out to us on our live chat or at support@risika.com."